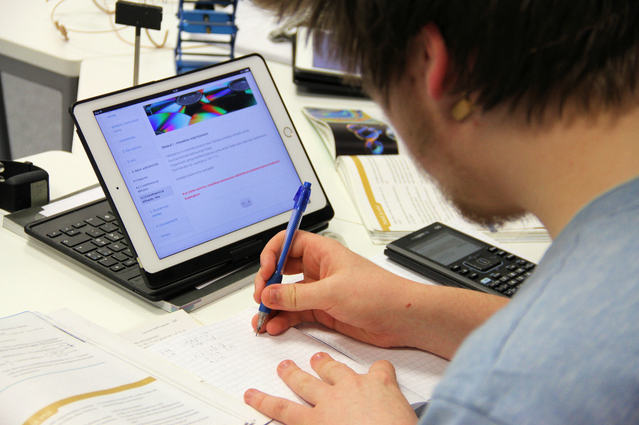
Spring was a hectic period for the SLAM team due to intense data collection. The team collected data from two high school Advanced Physics courses involving a total of 43 students and 36 sessions. During the courses the students solved physics related problems using experimental equipment including lasers, lenses and online simulations. Twelve of the sessions were held in LeaForum research laboratory equipped with the MORE system [1] for high quality audio and video recording and twelve Empatica E4 sensors [2] were used to track students’ physiological signals. This yielded 101 hours of video, 266,216,000 (more the a quarter of a billion) data points of physiological data and 236,000 (almost a quarter of a million) log events from the virtual learning environment.
Virtual learning environment – Open edX
During the courses, Open edX served as the virtual learning environment (VLE). Taking advantage of its open source character, the SLAM team installed and hosted its own instance of the platform on a dedicated server. One of the main reasons why the team decided to use edX was its built-in event tracking system. It made it possible to track students’ navigation and interactions with the platform.
In practice, the VLE included task related materials and the script for collaboration. The script followed the same form in most of the sessions. Students started by doing a retrospective evaluation considering their last lesson. A collaborative learning dashboard was provided to support this phase (see the gauges below). After this, students continued with answering orientation questions, and then moved on to collaboratively working on the task. At the end of the lessons, students reflected on their performance by answering a short survey.
Values for the dashboard and evaluation came from the survey students filled out during the previous session. In addition, the history of measures was provided for students to see the overall evolution of their group according to their own self-reports. The dashboard as a tool was evaluated using a questionnaire on usability, usefulness and user experience. A quick look at the results suggests that many of the students were interested in the gauges and considered them useful. Further analysis might reveal how it affected their learning process.
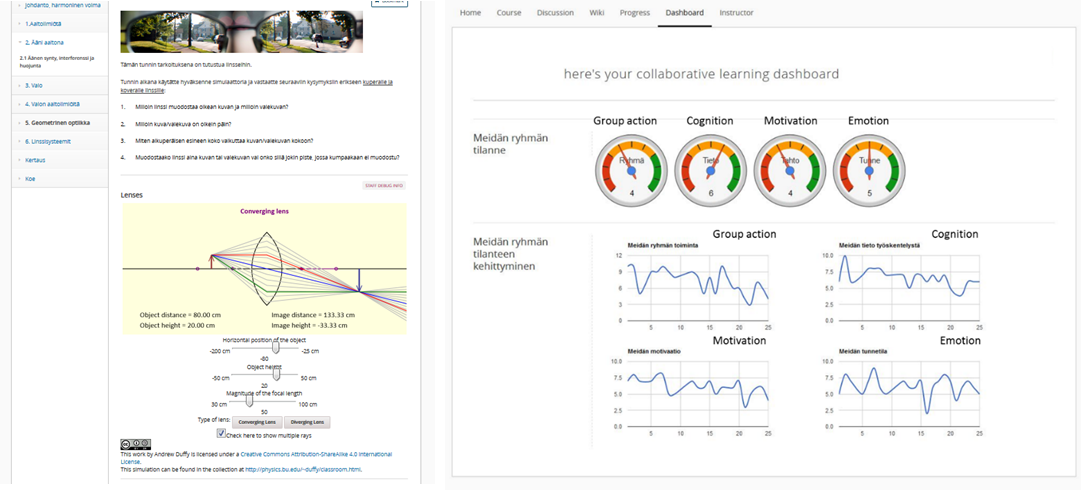
Left: Example of an optics task with embedded simulation Right: The Learning dashboard with gauges
What next?
The next challenge for the SLAM team is to continue the analysis with the extensive, multimodal dataset. Combining very different modalities of data isn’t easy and each data type also has its own challenges. The pilot study carried out during the spring in 2015 gave some useful ideas on where to start, which will be developed and enriched with the vast amount of newly collected data.
Over one hundred hours of video data will be compressed and coded in order to gain an insight into how students collaborated. The physiological data, recorded during collaborative learning situations, is being synchronized at both individual and group levels. Further signal-specific data processing and analysis will be carried out in collaboration with the Oulu University Biosignal Processing Team, led by Prof. Tapio Seppänen and with extensive expertise in this area. Events from the Open edX VLE are also to be synchronized with the physiological data, as an indispensable context-related complement. To this purpose, the raw data in the databases from the platform and text files with log data are being processed.
To sum it up, extensive, multimodal data has been collected from the February to June 2016 SLAM experiment. An exciting period is starting, as we start to focus on data analysis. We will keep you posted developments
References
[1] Keskinarkaus, A., Huttunen, S., Siipo, A., Holappa, J., Laszlo, M., Juuso, I., Väyrynen, E., Heikkilä, J., Lehtihalmes, M., Seppänen, T., & Laukka, S. (2015). MORE–a multimodal observation and analysis system for social interaction research. Multimedia Tools and Applications, 1-25.
[2] Garbarino, M., Lai, M., Bender, D., Picard, R. W., & Tognetti, S. (2014, November). Empatica E3—A wearable wireless multi-sensor device for real-time computerized biofeedback and data acquisition. In Wireless Mobile Communication and Healthcare (Mobihealth), 2014 EAI 4th International Conference on (pp. 39-42). IEEE.
 RSS Feed
